Understanding place catchments and the dynamics of people’s mobility to help drive winning place strategies
In this blog from Chris Duley, Didobi Associate and Founder of Adept Insight, discusses the varied mobility behaviours (pre- and post-Covid) and how new high volume, high frequency geo-data can be utilised to measure footfall and define catchments and importantly dynamically track the impact of interventions and investment in our town centres and high streets.
The reasons why people visit places, including High Streets and Town Centres, are many and varied but often inter-related. Trip drivers include work, retail and leisure activities and access to services, healthcare and education. How far people are willing to travel, how often and when they visit places also vary and are influenced by trip purpose, which in turn is affected by the availability of, and accessibility to, other competing destinations (other places) that can meet trip needs. The origin of trips and visits is also important, with journeys starting from home, from work or associated with other activities such as retail or leisure.
Places compete for our time and very often our money, with their strength or attractiveness and accessibility, as well as their proximity relative to other surrounding places, often determining footfall levels and the size and share of their place catchment.
Mobility behaviours that generate footfall at places and define their catchments have been much impacted by Covid restrictions, with many working from home, all of us staying local and with non-essential retail and much of the leisure and hospitality sector closed for lengthy lockdown periods.
Using new high volume, high frequency geo-location data from mobile devices we have been tracking mobility behaviours and monitoring place catchments since the start of the pandemic and comparing them to pre-pandemic levels. This has enabled us to accurately measure and benchmark trends across individual places.

Source: Didobi analysis using Huq Mobility data
As we gradually emerge from Lockdown 3, and the (hoped for) permanent transition to a Post-Covid environment begins, there is much speculation about what the “new normal” will look like.
- – Will we revert to pre-Covid mobility behaviours?
- – Will workers return to their city centre offices?
- – Will localism persist?
- – Will there be a reluctance to visit large retail venues?
- – Where will we spend our leisure time when we have the freedom to choose?
Is there also an opportunity for urban planners to move away from the pre-Covid status quo?
Will they build on our new-found localism and embrace neighbourhood planning (including the “15-minute city” concept) to design more self-contained communities, with locally accessible services, activities and opportunities that satisfy the needs of everyday life for local residents? This would have significant impact on mobility patterns and footfall, increasing movement and dwell time locally and reducing interaction with the wider urban environment.
Analysing new mobility data is key to helping us to answer these questions by tracking individual places and benchmarking their footfall performance and catchment extent and profile.
Even before Covid there was a lot of focus on Town Centre regeneration and “saving” our High Streets.
What is really exciting about harnessing this new mobility data is the ability to dynamically track the impact of interventions and investment in our town centres and high streets.

Source: Didobi analysis using Huq Mobility data
At Didobi we are strong advocates of using data to help drive decision-making and monitor the impact of changes to support placemaking and investment.
Using a mobility data-driven approach to provide a new and more dynamic view of places and people we can help you to develop a winning location strategy through:
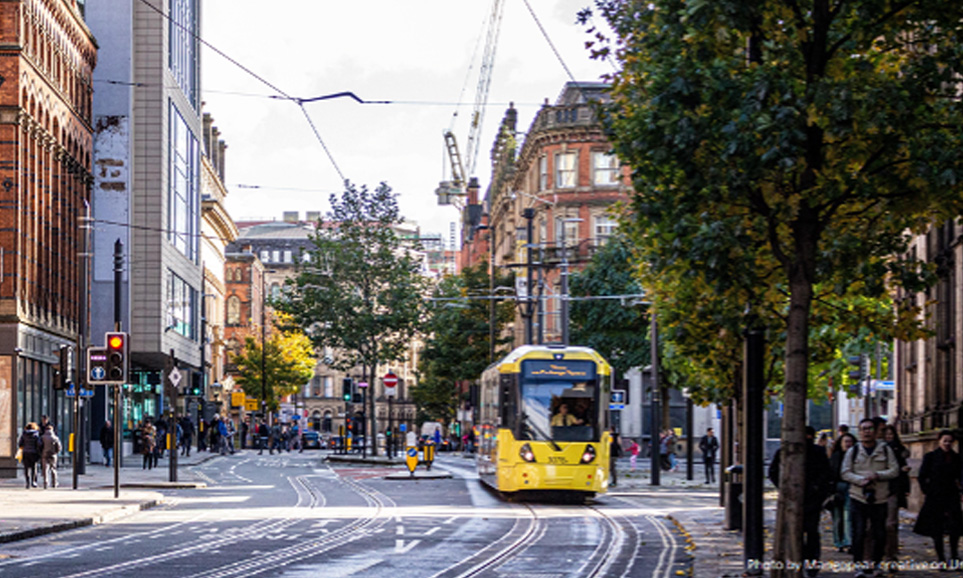
- – A better understanding of your current situation. Defining your place catchments, measuring and profiling your footfall, including granular footfall mapping to identify hot spots (and cold spots) within town centres and other place types. This can be split by time of day and day of week as necessary, for example to investigate the night-time economy
- – Benchmarking your town centre (or other place type) with neighbouring or peer locations to measure your place performance and to help frame appropriate and achievable change strategies
- – Reviewing and benchmarking the impact of Covid on your place catchment size and configuration and its footfall levels and profile
- – Monitoring and dynamically tracking catchments and footfall, including before and after snapshots to measure the impact of interventions or investments
- – Measuring and monitoring accessibility to and mobility related to service and activity provision (inc. retail, health, education, leisure and workplace) to support urban policy and planning.
There are many ‘footfall’ datasets in the market and as a key Future High Streets Funding criteria an increased opportunity for implementation has arisen. Understanding what you are trying to measure and why, should determine the type of footfall data, micro or macro or both, that you should use. Understanding accuracy, currency, sample size and any biases in the data are critical to success and deriving value from your investment. Footfall data is not what many people think it is or understand it to be so make sure you know or ask an independent organisation such as us to help explain and implement the right solution for your needs.
Understanding where people are, where they have come from and what they are doing is key to delivery of successful towns and cities. Get in touch if you want to hear more about how we can help you to harness the power and value of data when it is correctly sourced and applied.


Leave a comment: