UK Retail – facts, measurements and viewpoints
British Government figures from 2012 show that UK wholesale and retail trade contributed 16% of economic output and 16% (4.3 million people) of employment. More up to date data from April 2014 shows that consumers in the UK spent around £27 billion and of every £1 spent (online or in shops but excluding petrol stations) £0.47 was spent in food stores and £0.46 was spent in non-food stores with the remainder spent in market stores.
The UK is a small densely populated country, which has undergone a transition from a manufacturing based economy to a service based economy over the last century. The resulting provision of retail property is also significant, be it within the 850+ towns and cities, the 1,200+ out of town retail parks or the 900 shopping centres. As such the UK has one of the highest ratios of retail space to population in Europe. So the bricks and mortar ratio to consumers is higher than on average but this is accentuated further as the UK leads the pack with regards online sales. The Centre for Retail Research estimates this online share of retail sales as 13.5% for the UK with Germany the nearest European rival at 9.7% with France down at 6.9% and Italy a mere 2.1%, which is behind Poland and Spain who are circa 3%. ‘Remote’ selling be it online or through catalogues has been in the UK for a very long time where both Argos and Next have led the way and built very strong businesses. Next have been far faster at assimilating the two channels but Argos has followed in the last year with its new ‘digital stores’.
The significant provision of bricks and mortar space along with a highly evolved online sales channel in the UK makes for a ‘perfect storm’. Add into the mix a major recession and what you see is significant structural change in response to the challenging market conditions along with high levels of business distress, stress and failure. The UK has and is experiencing all of these criteria and recent failures of La Senza and Phones 4U (the largest administration since Woolworths in 2009) shows that we are not out of the woods yet.
The impact on UK retail real estate since 2008 has been significant and can be looked at from two key angles – vacancy rates and occupancy profiles.
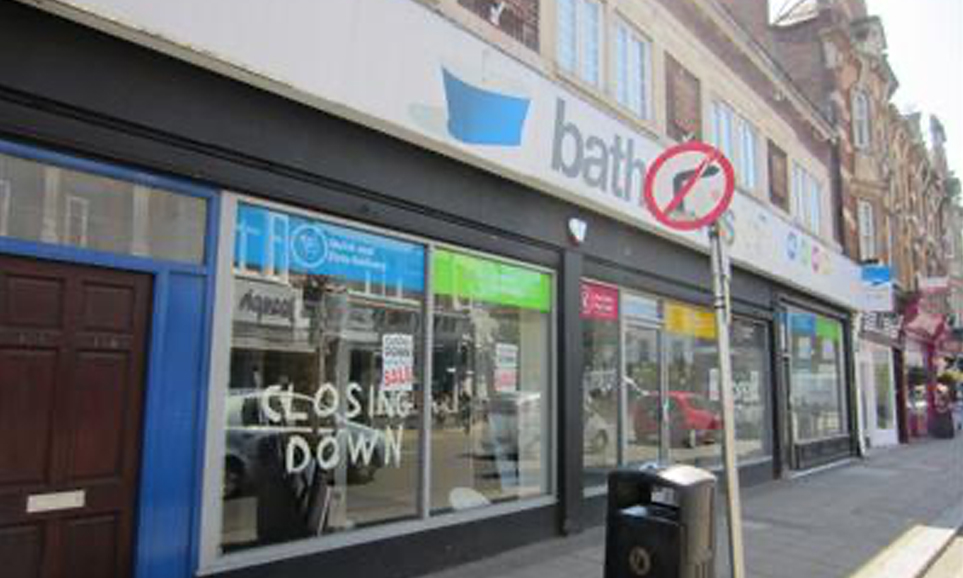
Vacancy Rates
The Local Data Company (LDC) has been tracking shop vacancy rates across Great Britain since 2008 and has seen vacancy rates rise from an average of 4% in 2008 to a peak of 14.6% in 2011 and 2012 but this has now come down to 13.3% as of September 2014. Analysis of over 3,000 retail centres across Great Britain reveals the significance of this rate with over 50,000 retail and leisure units standing vacant. The national picture also masks the significant variances by region, town and property type.
LDC’s latest analysis of retail and leisure vacancy rates shows that small towns (<200 units) are in the healthiest state at 8.9%, which is a 0.1% improvement on the end of 2013. Medium towns (200-400 units) have also shown a decrease in their vacancy average by 0.2% to 11.7% and large towns/cities continue to have the highest overall ‘town’ vacancy rate at 12.9% but have also shown the greatest improvement at -0.6%. Overall Retail Parks lead the pack at 8.9%, which is an improvement of 1.5% on the same period last year and Shopping Centres continue to have the highest vacancy rate average at 15.3% which is an improvement of -0.8% on 2013.
Regional analysis shows improvement in all regions with the exception of the North East ((+0.4%). In order of improvement they are – South West (-1.7%), South East (-1.3%) East Midlands (-0.8%), Yorkshire & The Humber (-0.8%), London (-0.5%), East of England (+0.5%), West Midlands (-0.4%) and the North West (+0.4%). The North West’s vacancy rate of 16.9% is still more than double that of London which is 7.8%.
LDC’s new Health Index, developed in partnership with Morgan Stanley, analyses 10 qualitative and quantitative attributes of vacancy and occupancy and shows that of the 3,000 locations analysed, in and out of town, there is an overall balance of 20% improving and weakening centres, with 60% being stable. When applied to High Streets then the balance is more positive with 24.4% (277 High Streets) improving and 17.4% (197 High Streets) weakening. Analysis by size of High Street shows 31.8% of small High Streets improving compared to only 4.5% of large High Streets. Medium High Streets are at most risk with 20.6% weakening and only 14.3% improving.
The persistency of vacancy is something I believe is a key indicator of health as it clearly indicates the health of a location. Analysis of over 1,200 retail centres revealed that over 10,000 of the vacant units have been vacant for more than three years. This is a clear indication of over supply and a need for change of use or demolition.
Whilst there has been significant change in the vacancy rate we have also seen significant structural changes with regards the profile of the occupiers that remain. 66% of all the units that LDC tracks are independent businesses (with less than 5 units). Every year nearly 100,000 retail and leisure units open or close which equates to an average churn rate of 10% per annum i.e. 1 in 10 units change during a typical year. Chain retailers (multiples) have shown consistent decline in their numbers overall, especially in town centres, for the last few years with a peak in net closures being reached in 2012 at 1,776 net closures in the top 500 city/town centres alone. Contrary to popular belief the independents have continued to grow but this growth has slowed significantly from its peak of 4% in 2010 to 0.69% in 2013. Significant in-town retailers such as Next and Marks & Spencer are closing in-town stores in favour of out of town retail parks where parking is free, the ability to create an ‘experiential destination’ is easier and it plays to the logistics requirements of ‘click & collect’.
As a result of weak consumer spend, the growth of non-food retailing by the supermarkets and the increasing impact of online sales, traditional comparison goods shops have been on the wane with consistent decline since the end of 2010. Aracadia Group is a very good example of a retailer consolidating into fewer larger shops. The UK has also seen the rise of value retail where discounters have grown by nearly double the rate of the supermarkets with a growth rate of 22% since 2011. Fixed price discounters have grown exponentially at 54% since 2011! The British High Street has also seen a significant rise in food & beverage outlets and entertainment along with services such as nail bars, tattoo parlours and cheque cashers/pawnbrokers. Charity shops, which receive an 80% reduction in property tax, have also taken advantage of the opportunities afforded with rising vacancy rates and declining rents.
This short synopsis shows that many threats but also many opportunities lie within the UK retail property market but knowing where, when and with what return is critical. LDC’s unique insight sourced from its field researchers along with its own innovative technology combined with its partnership ethos with the UK’s leading universities and its clients ensures that it is able to inform on the impacts and opportunities that these changes are having all the way from an asset to a country.


Leave a comment: