Why and how can data help us create better places?
In previous blogs the team at Didobi have talked about the need for commercial real estate investors and occupiers to recognise that as well as their core business, which is often their sole focus, they are most importantly in the information or data business. This calls for a joined-up data strategy where all areas of the business that have or create data are integrated in order to effectively create one massive data jigsaw where the picture gives your true insight on your business, its performance and its opportunities and threats.
A fundamental basis to this recognition of data in a business is knowing what question you are trying to answer or what problem are you trying to solve. Many businesses fail at this first hurdle as they set out to manipulate or analyse data hoping it will create a question or answer, a problem or solution without having defined it in advance or recognised the need for impact in the business.
“Where there is data smoke, there is business fire.” — Thomas Redman
Local authorities and councils are no different to the businesses but arguably have a more significant role in society as the ‘custodians’ of our cities, towns and places. They have similar disjointed bureaucratic structures as large companies and silos of data inaccessible to the many.
Understanding how people interact with physical spaces and services is surely key to knowing how best to serve them? Data must lie at the heart of this understanding if evidence-based decision making and engagement with communities is to happen successfully.
“Data beats emotions.” – Sean Rad
Over a number of years and especially most recently with the work that Didobi does in towns it is clear that data does not receive the recognition that it deserves especially in such uncertain times as we face today. In most cases there is not a conscious ignorance but often the inability due to time, role or knowledge to see HOW data might help answer questions faster and better and how it might enable more solutions and more complex solutions at that.

A single customer view is what good retailers have and in the same way local authorities and towns should have a single view of their cities, towns and places. Such a view can be achieved using the right data and insightful software. Very few true examples exist but one of note is the way that the London Borough of Barking and Dagenham (LBBD) track their Social Progress Index. LBBD is one of the most deprive London Boroughs, yet they recognise that to achieve progress they need to understand where they are today in order to engage with their communities to help drive change for the better. Over eighty different datasets have been brought together under one ‘roof’ (portal) which you can openly view at https://www.lbbd.gov.uk/social-progress-index where you can also view and interact with the data HERE
“In God we trust, all others bring data.” — W Edwards Deming
Councils and local authorities hold much data and there are many commercial datasets available but the capability and motivation to bring them together to form one view of a place and its people is very much unrealised in my experience. In the past we either did not have the data or the technology and now we have both! This enables us to look at cause and effect of policy, taxation, community engagement, interventions as well as compare and contrast to other locations.

Emu Analytics is an example of how fast the capability of software has developed. Emu Analytics are a start-up software and data analytics company who I have had the pleasure to work with over the past year. Having spent quite a few years in the world of commercial property and retail data as well as building platforms to hold the data it has been fascinating to work with a software company with practical data science experience to see how this marriage of data and technology can work given the right question or problem to solve. You can see who and how they work on their website but the potential that I have been working on with them has been around an insights platform that can help councils capture, collate, analyse and visualise multiple sets of data from multiple sources.
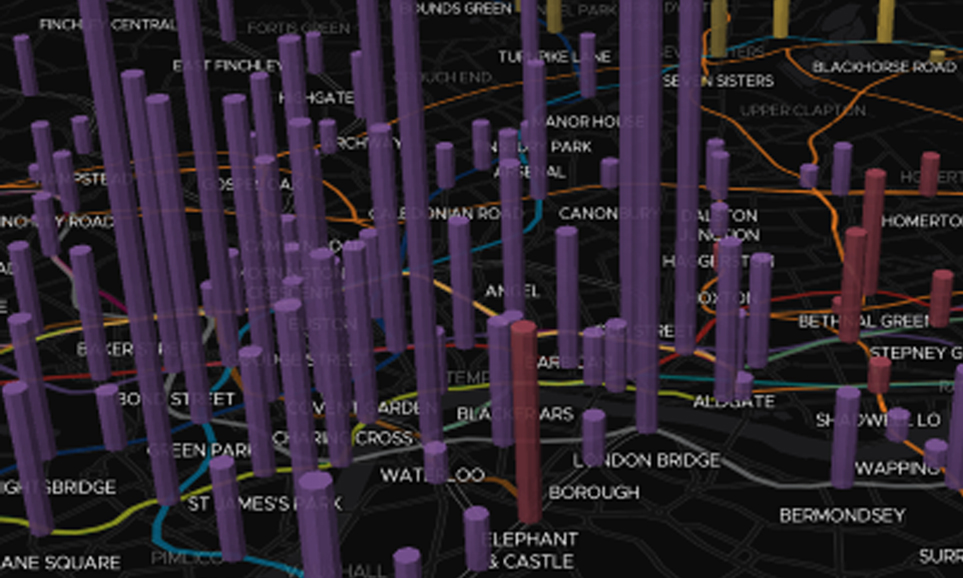
Many data portal exist for the display of a specific data product but having the ability to integrate and overlay multiple datasets from multiple data sources adds a whole new dimension to the power of data. This presents a new and exciting challenge of being able to understand the interrelationship of data which has immense power when it comes creating a single view of a place. A good example of this might be the proximity of fast food outlets to schools, the performance of those schools, the health profile of the pupils, the proximity of transport networks and the resulting noise or environmental pollution. This example alone brings together the three most important factors which are Economic, Social and Environmental. Below is a view of noise pollution around schools in the Stockport area.

The key thing about software that Emu Analytics builds is that it can be optimised to hold static data or live data such as transport networks, traffic flows, people movements, weather etc and from this you start to overlay different data and then start to analyse and map patterns in the data which then lead to an understanding of over or under performance and most importantly identify issues before they become a major issue.
So, in summary, Councils and Local Authorities need to recognise the opportunity that data presents and the importance of maintaining an evidence base that can:
- Identify threats and opportunities
- Flag up potential issues before they become a major problem
- Understand the relationships between different data and how change in one impact change in another
- Curate and share highly visual data maps that enable non-technical users to see what is happening and therefore understand. This enables more people to be positioned to assist in delivering a solution.
“Tell me and I forget, teach me and I may remember, involve me and I learn.” – Benjamin Franklin
A new video has been released by Emu Analytics which shows you in less than four minutes how this software should be able to help your local authority, council and town. You can view it here.


Leave a comment: