
Who and where are the risers and fallers in the UK food and beverage market? (Part 2 F&B Market Series)
Part 1 of this food and beverage snapshot showed the accelerated growth in F&B outlets across the UK in the last 12 months (from July 2016) with growth coming from both independent operators and chains (with more than five units nationally). Part 1 covered the macro trends and this next section will look at which operators have been growing and contracting, along with the location types where this change is occurring.
This analysis has looked in detail at 1,217 cities, towns and localities. 25% of the locations saw a reduction in the number of food and beverage (F&B) outlets whilst 46% saw an increase, with the remainder seeing no net change (increase or decrease).
In terms of percentage net change, the smaller locations beat the rest with places such as Formby, Hebburn, Chelmsley Wood, Cowley and Kirkham all seeing changes of 30%+. The larger centres, be it Loughborough, Croydon or Leek, saw an increase of c.11%. Of the cities, Newcastle upon Tyne showed the largest increase at 7.2%. Of the large towns, Northampton comes top with an increase of 7.0%. In the fallers, it is interesting to note that Jesmond, near to Newcastle upon Tyne, saw a 28% reduction in outlets with other large drops being seen in Hillhead East in Glasgow and Farncombe Road in Worthing, both at -40%. Other stand out locations where falls occurred include Finsbury Park in London, Sidcup and Haverfordwest.
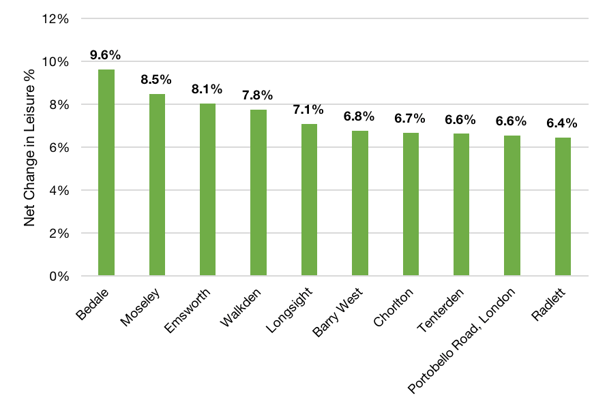
Figure 1. Top 10 towns with the largest net increase in Leisure units (%) – June 2014 to June 2017. (Source LDC)
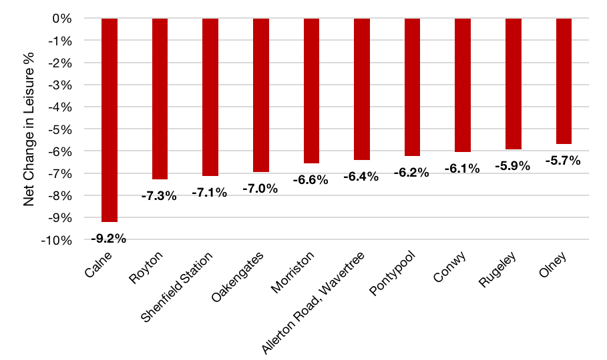
Figure 2. Top 10 towns with the largest net decrease in Leisure units (%) – June 2014 to June 2017. (Source LDC)
In terms of actual units, the greatest growth outside of Central London was Edinburgh, Newcastle upon Tyne, Croydon and Liverpool who all saw increases of 20+ units. On the other end of the scale Manchester, Brighton, Darlington, Dundee, Gloucester and Woking all saw a reduction of seven units or more. London shows significant variances, with Central London experiencing the biggest net increase in F&B outlets (+66), while West London saw the biggest drop (-7). Other locations within cities, such as Spinningfields in Manchester, saw high churn rates where more pop-up restaurant concepts occur and may, or may not, survive.
Who are the expanding F&B operators?
104 fasciae have increased their presence by 25% or more with Mod Pizza leading the way at 400% and others such as The Bierkeller, Coco Di Mama and the Pizza Pilgrims being examples of fasciae with 100% + growth rates.
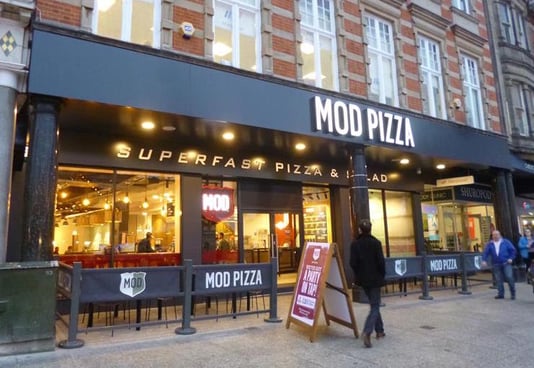
Image 1: Mod Pizza, Nottingham. (Source: LDC)
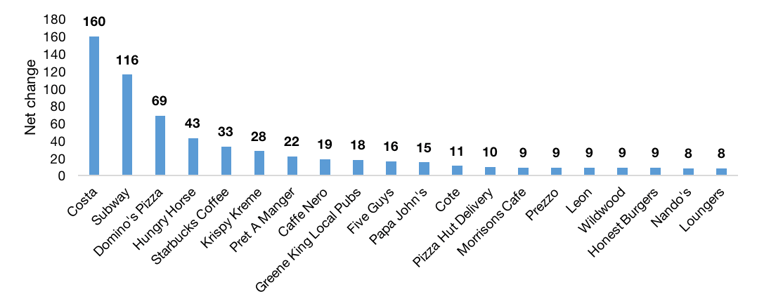
Figure 3. Top 20 F&B occupier openings by net change (number of units), 2016-2017 (Source LDC)
In terms of physical unit growth, more familiar names come to the fore such as Costa with over 150 new outlets and Subway with nearly 120 new outlets openings since July 2016. Behind them, Domino’s Pizza, Hungry Horse, Starbucks, Krispy Kreme and Prêt A Manger have all increased their estates by 20+ units.
 Image 2: Starbucks, Manchester. (Source: LDC)
Pizza takes the most expansive prize by volume of operators with Domino’s Pizza, Papa John’s, Pizza Hut Delivery, Wildwood and Prezzo in the top 20 by growth in units. Subway takes the crown for the most outlets nationally with over 2,100, closely followed by Costa and then Domino’s Pizza some distance behind with over 900. Whilst Greggs might be classified as a Baker it would be foolish to ignore their presence with over 1,700 outlets and a growth rate of 5%.
Part 3 and the final conclusion to this blog will be published shortly, make sure you check back on this blog, or subscribe here to receive LDC’s weekly newsletter so you don’t miss it.
This blog was first published on the LDC.com blog.


Leave a comment: