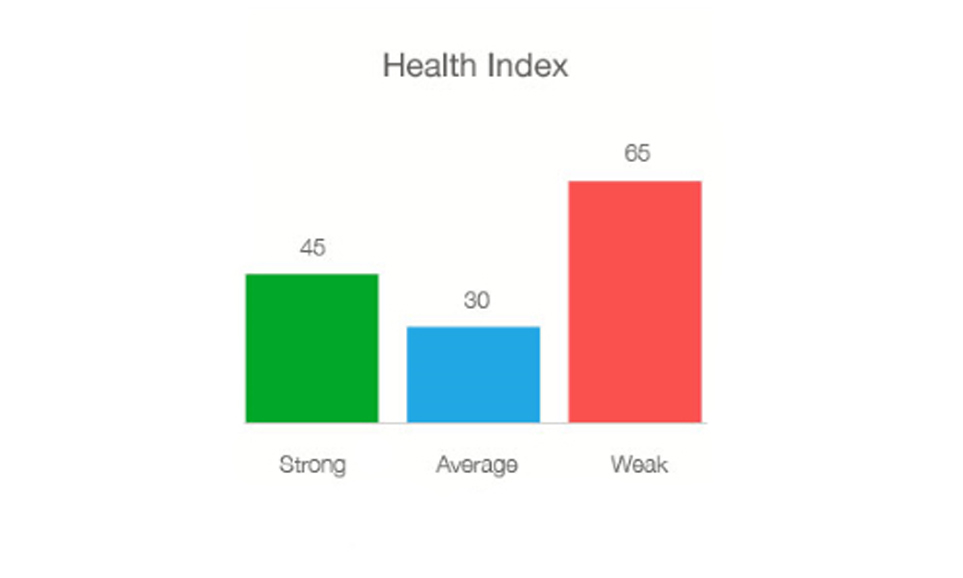
What determines the ‘health’ of a place?
Last week we released a new overview dashboard to our online insight platform (LDO). This was not just a software release but also a significant milestone on our journey to better understand the heartbeat of the UK’s retail and leisure locations many of which are a key feature of many communities.
As part of the ‘jigsaw’ we are building at LDC the new pieces, which we brought to the new overview tab, were:
- Inclusion of the new Health Index we created in partnership with Morgan Stanley, which gives an index rank, health, score as well as the breakdown of each of the index attributes. An index attribute could be persistency of vacancy, the presence of key retailers such as Next or the food and beverage offer (dwell score). This index is at location level i.e. high street, shopping centre and retail/leisure park.
- Town centre Diversity Index, which we created in partnership with the Oxford Institute of Retail Management, which is part of the Said Business School at the University of Oxford. This shows how change is occurring across four core diversity types (Restaurants, Consumer Services, Leisure Services and Services) and then a total diversity index based on the Comparison Goods and Convenience Retail offer.
- Population based on the local authority area that a location sits in. This will be further refined in a new catchment model that we are building with one of our university partners.
- Average Weekly Earnings that looks at the area relative to the region and national rate since 2008. Clearly wealth is a key factor in the economic health of a location.
- Crime statistics, which is based on the number of crimes reported per 1,000 people per year for the local authority. High crime rates have serious social and economic impact on an area especially with an ageing population who may fear to venture out and thus spend money in the shops. This is peered to the region and national rate since 2008
- Unemployment rate of the local authority area back to 2008 and peered to the region and national rate.
- Employment profiles which we have summarised to three core groups – managerial & professional, tradesman, caring & leisure and sales, plant operatives & elementary. Based on local authority area.
Below are two screenshots from LDO, which show you Scunthorpe and Kingston upon Hull, which are not far away from each other and divided by the River Humber. I have randomly chosen these two places to highlight the value that this new overview with the additional data brings to delivering a better understanding of these places.


A quick FACT SUMMARY shows that whilst Hull has a higher vacancy rate than Scunthorpe (21.1% v 18.3%) it has much better Health Index (ranking of 4 v 2) scores showing that it is a more sustainable and attractive destination with more chain retailers. This is further reinforced when you look at the total diversity where Hull has a score of 0.37 (stable) versus Scunthorpe’s 0.24 (getting worse). Finally, whilst Hull has nearly double the population ( 336k v 168k) its average weekly earnings are £14 less (£502 v £516), its average house price is over 30% less (£67k v £99k).
When is comes down to the people stats then Scunthorpe has a significantly higher crime rates (61 v Hull’s 41), the unemployment rates are very similar (6.9% in Hull v 7.1% in Scunthorpe. Of note is that both are below the regional and national average!
Finally, the occupation profile varies significantly with 31.2% managerial and professional occupations in Scunthorpe area and 44.3% in Hull. Again of note is that Scunthorpe’s representation of these worker groups is below the regional average of 39.5% whereas Hull is above.
Hopefully this gives you a quick feel for how these data attributes interact to create key evidence on a location that will determine your success as an occupier, investor or landlord in over 3,000 locations across Great Britain. These places are constantly changing and as the well known nautical saying goes ‘not all boats rise on the tide’ – which of your ‘boats’ are not rising?


Leave a comment: