
Is New Look’s credit downgrade reflective of the retailer or the industry?
This week saw Moodys downgrade New Look and House of Fraser’s credit ratings. With this in mind and the fact that there is a new management team at New Look delivering a new strategy then a shallow dive on their physical store estate is of interest especially when benchmarked to others in the fashion and clothing sector.

New Look has over 550 stores and has continued to open new stores in the last 12 months. The extent of their coverage is seen by the map from LDC’s insights dashboard in Figure 1. Nearly half of their stores (48%) are located within shopping centres with 37% in high streets, 12% on retail parks and the remainder (3%) in travel hubs and smaller locations.
This portfolio of stores is the largest by some margin relative to peers in the fashion and clothing sectors. Independent fashion shops lead the way in portfolio size with over 14,000 stores. Behind New Look is Peacocks with 464 and Next with 423. By contrast, the likes of River Island, H&M and Dorothy Perkins all have under 300 stores.
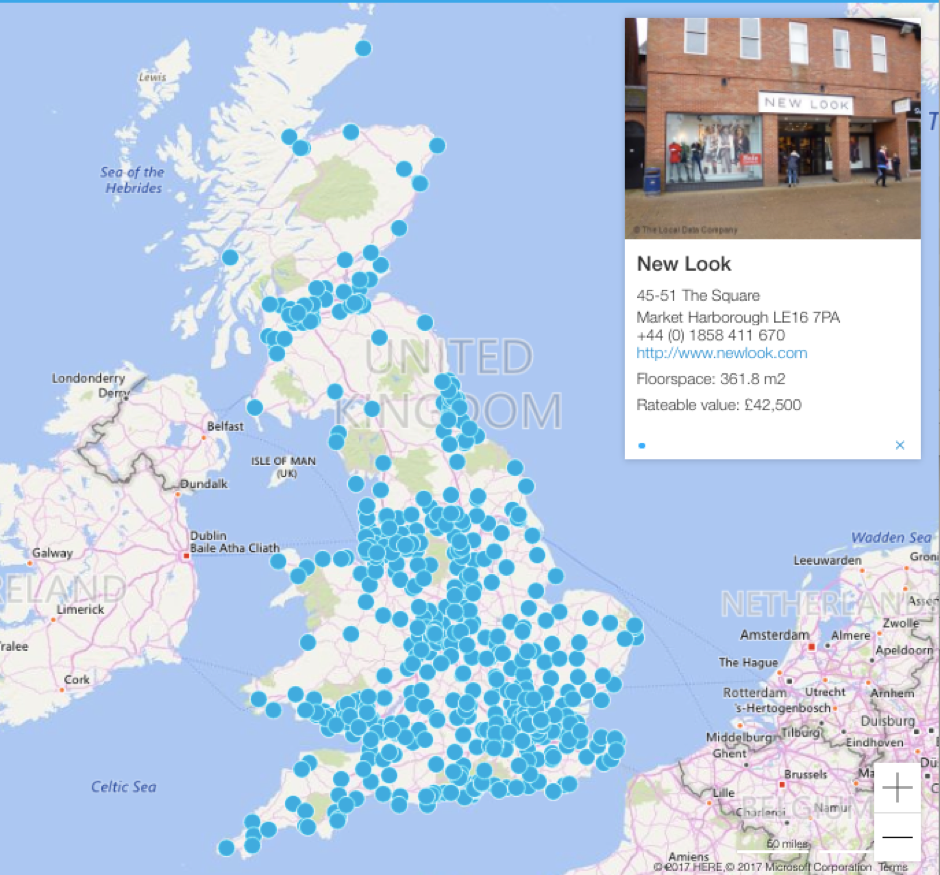
Figure 1: New Look stores across the UK (Source: LDC)
The fact that New Look have so many more stores than their peers stands out for me as stores are often one of the largest cost lines in such businesses. In the last published results back in June it was reported that New Look’s store sales continue to struggle but that its online sales jumped 14.3% one third of which were collected instore. Another significant unknown is whether New Look also suffers the industry average returns of 30% on these online sales and thus, degrading the overall profitability of this channel.

Location Overview
According to LDC’s location health index, New Look’s store profile shows it to have 6% of its stores in strong locations (Index score of 8-10), 60% in above average locations (index score 5-7) and 27% in weaker locations. This index merely reflects the ‘destination’ status of a place and what I do not know is the profitability of each store based on rent and rates and therefore the health index is only a part of the story about each store.
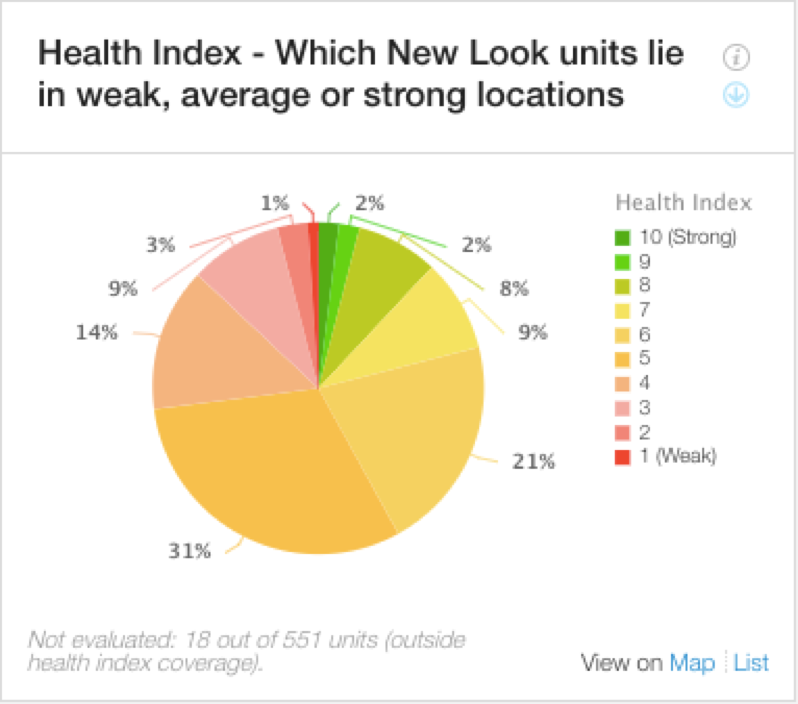 Figure 2: New Look units that lie in a weak, average or strong locations across the UK (Source: LDC)
Vacancy rates around their stores
LDC analyses trends in vacancy rates 200m around each store across GB since 2012 which saw the peak of shop vacancy rates in Great Britain at 14.6%, to 2017.
LDC has been analysing vacancy rates across GB for many years, mainly since 2012, which saw the peak in GB vacancy. Figures 3 and 4 looks at vacancy rates around New Look’s portfolio.
The red lines indicate the proportion of stores in high vacancy areas. Note the changes from Figure 3 to Figure 4 and see the number of stores surrounding New Look store has increased which is a good sign in terms of New Look being present in ‘destination’ shopping locations. The number of empty stores around a large number of New Look’s stores has also decreased but further analysis of who has filled these units is required.
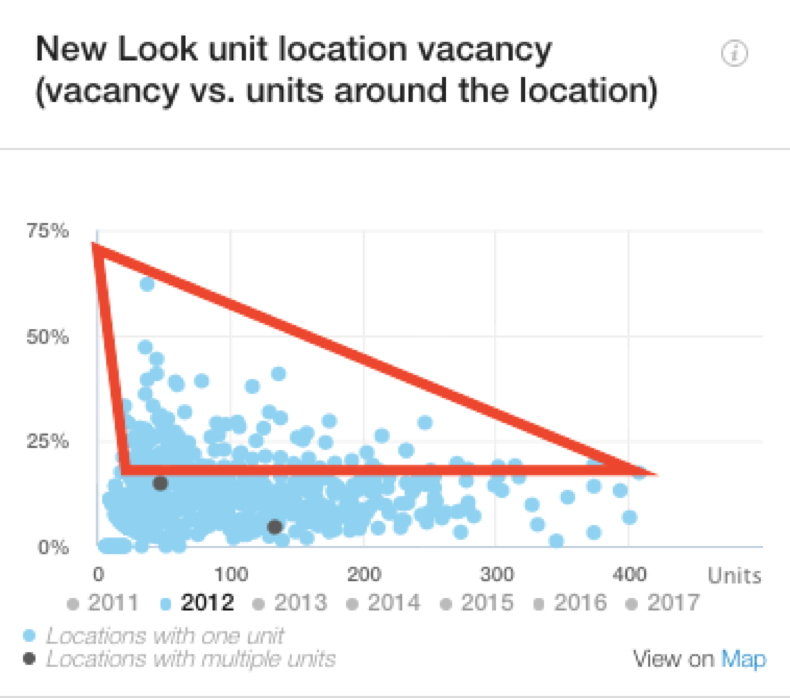 Figure 3: New Look unit location vacancy 2012 (Source: LDC)
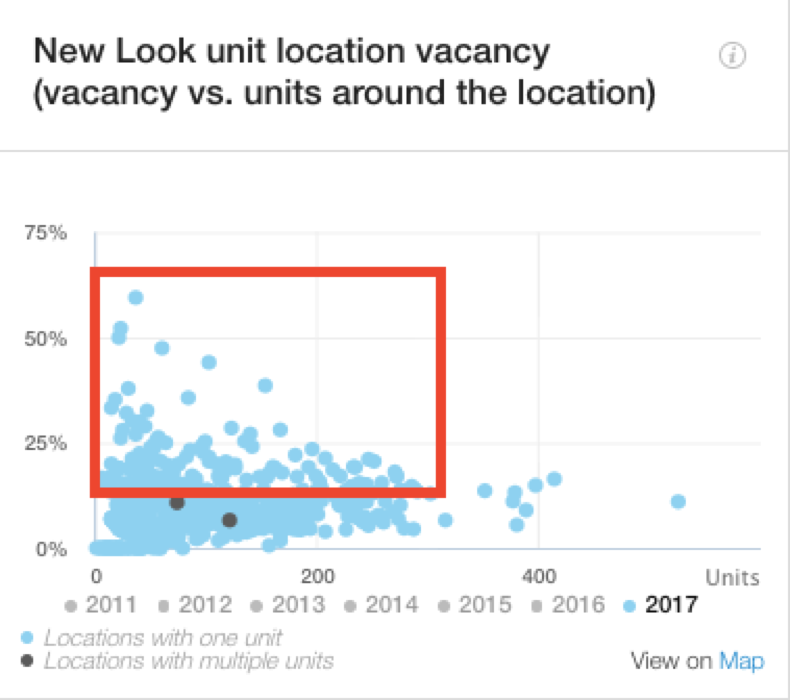
Figure 4: New Look unit location vacancy 2017 (Source: LDC)
Competitor densities around New Look stores
Another interesting area of analysis is to look at the competitor density around a store portfolio. One can look at this in two ways, either that a high density of competition could be detrimental to sales or that it could be a good sign in terms of clustering and thus the increased footfall volumes of an area having all the stores one would want to visit.
For this analysis of New Look I have selected the following fascia within the LDC dashboard:
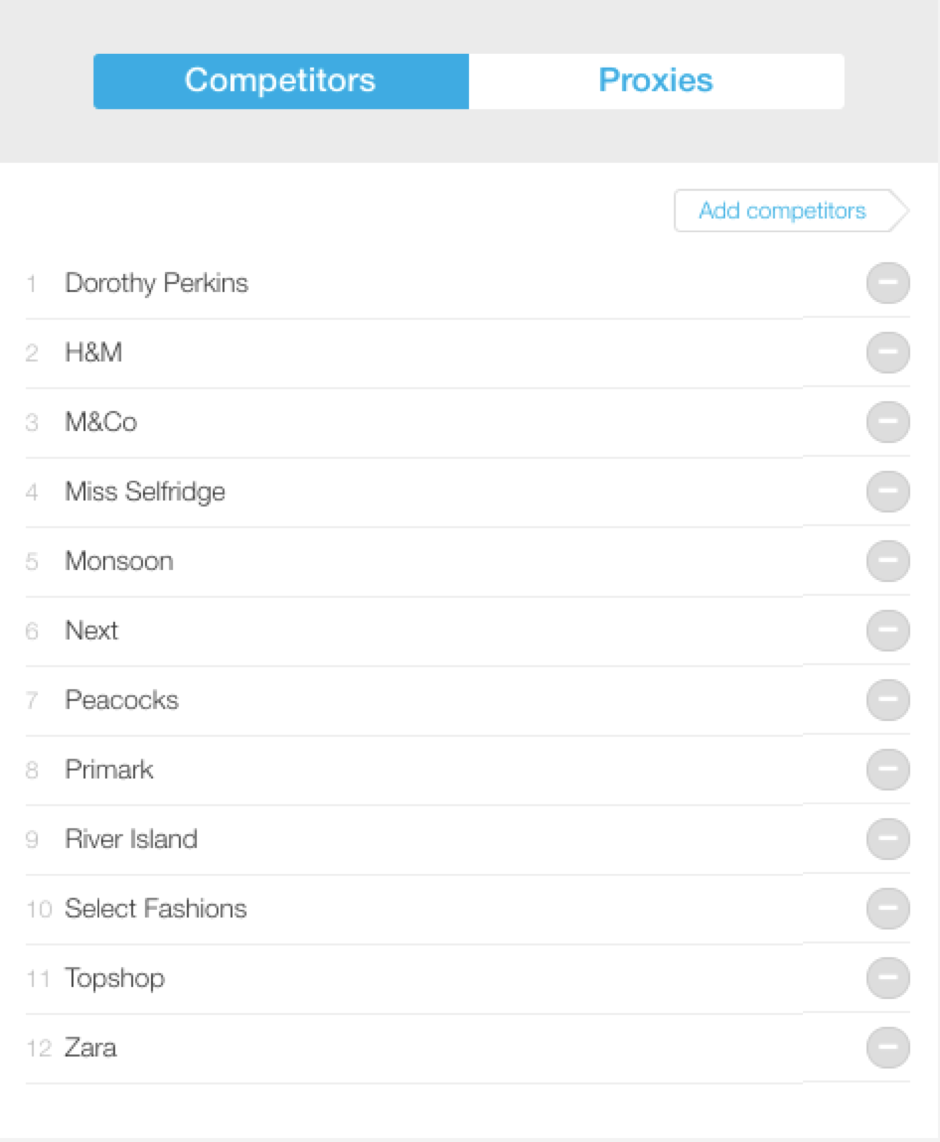
Analysis of how many of these ‘competing’ fascia are within 200m of New Look store shows that nearly one in five (19%) stores have six or more competitors nearby. This equates to 103 stores, the distribution of which can be seen below;
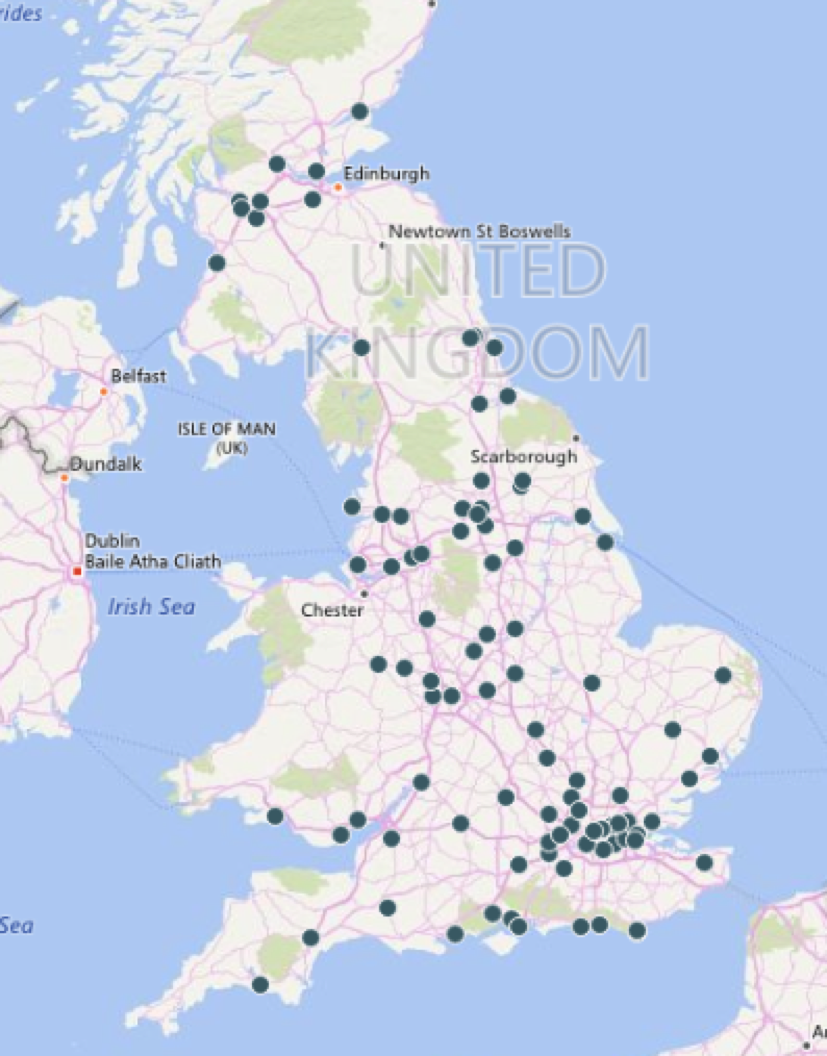
Figure 5: Map showing some of New Look’s competitors that are within 200m radius from a New Look store across the UK (Source: LDC)
The final element of analysis that is an indicator of future store success is when you look at what your competitors (or indeed any proxy brands) are up to around your stores. If having competitors nearby is good for your business then you would want to see more of them opening nearby but if they detract from your sales then you want them to be closing. Analysis of New Look’s competitors, as listed above, shows that Next, Dorothy Perkins, Monsoon and Zara are closing stores in New Look’s locations.
Cannibalisation or catchment overlap is also worth consideration especially with the rise of destination centres and current consumer shopping habits. For example, there are three New Look stores in the Nottingham area but infact within a 20 minute drive time there are nine! The big question lies in how many stores and what format is the best way for New Look to optimise sales in the Nottingham area?
In conclusion, through analysis of data such as this that LDC collects you can get a good view of a retailer’s portfolio relative to its peers along with the changes happening within it and around it which ultimately impact sales. There is a proven link between store presence and online sales and so the number of stores one should have and where is very specific to a retailer, their customer base and their sales channels. It was not that long ago that the City wrote off Argos as a basket case because of its large number of stores but if there was one retailer experienced and optimised for the world of online retail it was Argos. This may have been what attracted Sainsbury’s to partner to help this brand flourish.



Leave a comment: